 |
 |
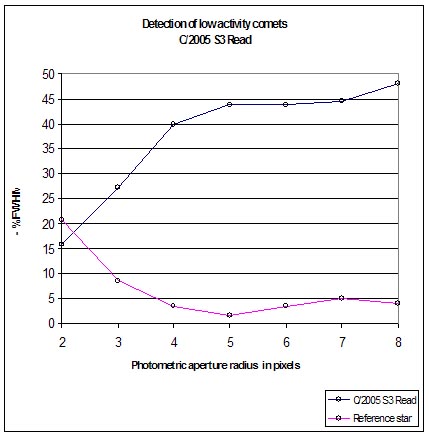
In summary the method consist in the following steps :
- Stack the images, with Astrometrica, on the body's motion, use
a wide enough photometric aperture.
- Measure the FWHM and signal to noise ratio of the body
- Open the astrometrica log and select the astrometric
information, copy and paste it to an excel sheet.
- Optionally, discard all the periferic data points (less than
20% of the total image width from the margin)
- Plot the data in a dispersion chart
To check the validity of this method I've tried it in all the
confirmation of NEOCP object resulting in comets that I did from La
Caņada since 2003. A radius of 4 pixels was used for all the
astrometry :
The following set of plots and images show statistics of the
signal to noise ratio of field stars as a function of the full width
at half maximum, the mean value of the FWHM would be a measure of the
resulting quality of the observation accounting for the combined
effects of seeing, focus, tracking, vibrations etc. A red dot has
been plotted representing the S/N and FWHM of the comet, the more to
the rigth the more diffuse is the comet. On the rigth column an image
of the object is shown for evaluation and comparison purposes.
|
 |
 |
| Non periodic comet C/2002 CE10, in the image no obvious
activity is seen, neither the FWHM is clearly different from that of
background stars, thus this is a non conclusive observation. A bigger
telescope with better resolution at a better seeing place is needed
in such cases. |
 |
 |
| Comet 2003 H3, even when the image doesn't show any
evidence, the FWHM plot shows a 8" false nucleus, clearly wider than
sorrounding stars. This case shows the power of this method. |
 |
 |
| P/2003 KV2, non conclusive observation. |
 |
 |
| P/2003 O3, no evidence of activity in the stack of
images and clearly wider psf, FHWM method indicates this could well
be a comet. |
 |
 |
| C/2003 W1, both, evidence in the image and in the FWHM
plot, in this case the method supports the new object is a comet. |
 |
 |
| P/2004 F1, No clear evidence of activity in the stacked
image and much wider than sorrounding stars psf. The method supports
this one being a comet. |
 |
 |
| C/2004 L1, too crowded images, no evidence in psf plot
neither in stacked image. FWHM does not always help! |
 |
 |
| C/2004 P1, fuzzy in the image with low S/N ratio, much
wider than background stars psf, seems cometary but not enough signal
to be sure. |
 |
 |
| C/2005 N4, non conclusive observation. |
 |
 |
| C/2005 Q1, obvious activity in the stacked images, also
helps the false colour rendition, the psf FWHM is much greater than
that of the background stars. |
 |
 |
| C/2005 Q4, obvious activity in both, image and psf
plot. |
 |
 |
| 2005 S3, obvious activity in both, image and psf
plot. |
 |
 |
| P/2006 M3 = P/1889 M1 (Barnard 2), no coma seen in the
stacked image and much wider psf than sorrounding stars in the psf
plot. |


